

Volume 28, Issue 1 (Winter 2021)
Intern Med Today 2021, 28(1): 98-127 |
Back to browse issues page


![]()
![]()
![]()
Download citation:
BibTeX | RIS | EndNote | Medlars | ProCite | Reference Manager | RefWorks
Send citation to:


BibTeX | RIS | EndNote | Medlars | ProCite | Reference Manager | RefWorks
Send citation to:
Malekzadeh A, Zare A, Yaghoubi M, Alizadehsani R. A Method for Epileptic Seizure Detection in EEG Signals Based on Tunable Q-Factor Wavelet Transform Method Using Grasshopper Optimization Algorithm With Support Vector Machine Classifier. Intern Med Today 2021; 28 (1) :98-127
URL: http://imtj.gmu.ac.ir/article-1-3796-en.html
URL: http://imtj.gmu.ac.ir/article-1-3796-en.html


1- Department of Electrical Engineering, Faculty of Electrical Engineering, Gonabad Branch, Islamic Azad University, Gonabad, Iran.
2- Department of Electrical Engineering, Faculty of Electrical Engineering, Gonabad Branch, Islamic Azad University, Gonabad, Iran. ,assefzare@gmail.com
3- Department of Electrical Engineering, Faculty of Engineering, Mashhad Branch, Islamic Azad University, Mashhad, Iran.
4- Institute for Intelligent Systems Research and Innovation (IISRI), Deakin University, Geelong, Australia.
2- Department of Electrical Engineering, Faculty of Electrical Engineering, Gonabad Branch, Islamic Azad University, Gonabad, Iran. ,
3- Department of Electrical Engineering, Faculty of Engineering, Mashhad Branch, Islamic Azad University, Mashhad, Iran.
4- Institute for Intelligent Systems Research and Innovation (IISRI), Deakin University, Geelong, Australia.
Keywords: Epileptic seizures, Electroencephalography, Feature extraction, Grasshopper optimization algorithm, Support vector machine
Full-Text [PDF 8951 kb]
(1572 Downloads)
| Abstract (HTML) (3848 Views)
Full-Text: (4865 Views)
Introduction
Epilepsy is a chronic noncommunicable neurological disorder which can affect people at any age [1]. It is a common brain disease and approximately 50 million people wordwide are suffering from it. Eighty percent of patients with this disease live in low- or middle-income countries. Seventy percent of these patients can have a seizure-free life if treated and diagnosed properly. The risk of premature death is three times higher in these patients than in general population. Three quarters of epilepsy patients dwelling in developing countries cannot afford to recive treatment [2]. These patients and their families suffer from discrimination and stigma. Generalized-onset and focal-onset seizures are two types of epilepsy [3]. Focal epilepsy affects one area of the brain. It is important to locate that area of the brain for proper medical attention. It is estimated that 60% of patients with focal epilepsy and 20% of those with generalized epilepsy become resistant to drugs and need surgery [4].
Various methods for epileptic seizure detection have been provided so far, including clinical methods and neuroimaging modalities; the latter are widely used by physicians [1, 2]. Generally, neuroimaging modalities are categorized into functional and structural modalities [1 ,2, 3]. Electroencephalography (EEG) is a functional neuroimaging modality for epileptic seizure detection [1, 2]. EEG signals provide essential information from the affected area which helps physicians to detect epileptic seizures with a higher accuracy [1 ,2, 3]. The diagnosis of epileptic seizures by EEG signals is a challenging task for physicians [1, 2]. The EEG signals are accompanied by relatively high complexity, which makes it difficult or challenging to correctly diagnose epile seizures [1, 2]. Accordingly, researchers have attempted to use Artificial Intelligence (AI) including Machine Learning (ML) [4 ,5, 6] and Deep Learning (DL) [7, 8] to diagnose epileptic seizures early via EEG signals. In ML-based Computer-Aided Diagnosis (CAD) system, the feature extraction techniques include time [9], frequency [10], time-frequency [11], and non-linear methods [12]. In DL-based CAD system, the methods for epileptic seizures detection include Autoencoders (AEs) [13, 14], Recurrent Neural Networks (RNNs) [15, 16], Convolutional Neural Networks (CNNs) [17, 18], and Deep Belief Networks (DBNs) [19].
Abedin et al. [45] provided an epileptic seizure detection method based on statistical features and achieved promising results. They first used a Bonn dataset and Discrete Wavelet Transform (DWT) method to preprocess and analyze EEG signals based on different sub-bands. Then, each DWT sub-band was examined to extract some statistical properties, and Artificial Neural Network (ANN) was employed for data classification. Singh et al. [48] proposed a new method for epileptic seizure detection from Bonn EEG dataset. They used Complete Ensemble Empirical Mode Decomposition (CEEMD) and Refined Composite Multiscale Dispersion Entropy (RCMDE) methods to conduct preprocessing and extract properties, and tested various methods for feature selection to reduce the size of the feature matrix. Finally, the ANN classifier technique was applied which led to promising outcomes. Aliyu et al. [49] presented an epileptic seizure detection method by selecting optimal wavelet transforms. To analyze EEG data, DWT was used to break them down into multiple sub-bands and extract various statistical information from each one. As a result, Correlation Coefficient and P-value (CCP) feature and Principal Component Analysis (PCA) were used to minimize the specificity. A Long Short-Term Memory (LSTM) model with the proposed layers was applied to categorize the inputs, resulted in 99% accuracy. Sameer and Gupta [50] considered Haralick texture features to present a method for detecting epileptic seizures from EEG signals, converted to two-dimensional images using Short-Time Fourier Transform (STFT) to extract Haralick texture features. Finally, the Decision Tree (DT) method was applied for categorization. The results reported 92.50% accuracy. Qureshi et al. [51] utilized Fractal Dimension (FD) and graph theories for feature extraction and used Electroconvulsive Therapy (ECT) for EEG signals pre-processing as the first stage of the study. Then, they extracted graph theory and FD-based features from EEG signals. Finally, they applied the Radio-Frequency (RF) method for classification and reached 98.50% accuracy.
The current study provides a novel method based on the extraction of statistical and non-linear features, feature reduction, and classification by the Grasshopper Optimization Algorithm and Support Vector Machines (GOA/SVM) model. The Bonn EEG dataset was used for epileptic seizures detection. Figure 1 illustrates the proposed method for epileptic seizure detection from EEG signals.
.jpg) Various wavelet transformations has been employed in different studies. The Tunable Q-Factor Wavelet Transform (TQWT) approach is one of the best methods for EEG signals pre-processing [20], which is more efficient than DWT for preprocessing and analyzing EEG signals based on different frequency subbands. We used the TQWT for preprocessing of EEG signals. Analyzing EEG signals by the TQWT method can imorove the accuracy of epileptic seizure detection. Various statistical and nonlinear features of EEG signals were extracted in the next stage. The AE model with the proposed layers was used to reduce the number of features which is a novel technique used in this study. The second novelty of this study is the use of the GOA combined with the SVM classifier. The GOA has not been used so far for epileptic seizure detection along with SVM. The GOA improves gradient optimization in terms of speed and performance. Gradient optimization algorithms are usually slow, and the selection of wrong parameters can lead to inefficiency. Moreover, these methods are not efficient for all problems. Thus, metaheuristic algorithms, such as genetic algorithm [53], particle swarm optimization [54], and breeding swarm [55] are applied for optimizing the classification algorithms. This paper is structured as following: Section 2 presents the methodology; the statistical metrics are presented In section 3; the results are shown in Section 4, and conclusions are presented in Section 5.
Various wavelet transformations has been employed in different studies. The Tunable Q-Factor Wavelet Transform (TQWT) approach is one of the best methods for EEG signals pre-processing [20], which is more efficient than DWT for preprocessing and analyzing EEG signals based on different frequency subbands. We used the TQWT for preprocessing of EEG signals. Analyzing EEG signals by the TQWT method can imorove the accuracy of epileptic seizure detection. Various statistical and nonlinear features of EEG signals were extracted in the next stage. The AE model with the proposed layers was used to reduce the number of features which is a novel technique used in this study. The second novelty of this study is the use of the GOA combined with the SVM classifier. The GOA has not been used so far for epileptic seizure detection along with SVM. The GOA improves gradient optimization in terms of speed and performance. Gradient optimization algorithms are usually slow, and the selection of wrong parameters can lead to inefficiency. Moreover, these methods are not efficient for all problems. Thus, metaheuristic algorithms, such as genetic algorithm [53], particle swarm optimization [54], and breeding swarm [55] are applied for optimizing the classification algorithms. This paper is structured as following: Section 2 presents the methodology; the statistical metrics are presented In section 3; the results are shown in Section 4, and conclusions are presented in Section 5.
2. Material and Methods
In this section, the proposed method for epileptic seizures detection in EEG signals is presented at following steps: Data selection, preprocessing, feature extraction, feature reduction, and classification.
Data seelction
The Bonn dataset was used in this study which has been recorded at the University of Bonn by a group of researchers and it had been widely used for epileptic seizure analysis and detection [22]. Bonn dataset is a publicly available dataset containing 500 single-channel EEG data. It was sampled at 173.6 Hz for 23.6 seconds. They consisted of five classes’ viz. S, F, N, O, and Z with 100 segments recordings in each class [22]. The O and Z data were collected from 5 healthy controls in a relaxed postion and awake state and using the 10-20 electrode placement standard. Intracranial electrodes were used on 5 patients with epilepsy to collect data of S, F and N classes. The epileptogenic zone and the opposite hemisphere were used for recording the signals of F and S classes, respectively during interictal period. Ictal period was taken into account for recording the signals of class S. Cutoff frequencies in the range of 0.53-40 Hz were applied with finite impulse response and 20 order band-pass filter for filtering of EEG data [22]. Figure 2 shows the EEG signals of the Bonn dataset.
.jpg) Other information about this database are presented in Tables 1 and 2.
Other information about this database are presented in Tables 1 and 2.
.jpg)
.jpg)
Preprocessing
For pre-processing of the EEG signals, the TQWT was used. It is a special type of DWT and is used in biomedical signal studies [20]. In TQWT, parameters include the redundancy, number of decomposition levels and Q-factor. Oscillatory signals are analyzed using higher Q-factors and transients are analyzed with lower Q-factors. The two-channel filter bank is applied for implementing TQWT. Low- and high-pass scale factors for this filter banks are represented by γ and δ. The mathematical expression for the frequency response to low-pass filter and high-pass filter are presented in Equations 1 and 2, respectively [20]:
.jpg)

For further information regarding the TQWT, see reference [20]. The TQWT parameters were selected similar to those reported in Ghassemi et al.’s study [34] (Q= 1, r = 3, and J= 8). In Figure 3, the TQWT sub-bands are illustrated based on the defined parameters.
.jpg) The TQWT frequency response is shown in Figure 4.
The TQWT frequency response is shown in Figure 4.
.jpg) Feature extraction
Feature extraction
In this section, we presented different feature extraction methods for epileptic seizures detection. Frist, the TQWT was used for EEG signals decomposition. Different features such as statistical features, non-linear features based on FD method and non-linear features based on entropy algorithms were extracted from the TQWT sub-bands.
Statistical features
Five statistical features were extracted from the TQWT subbands [23] presented in Table 3.
.jpg)
FD-based features
The FD-based non-linear features provide significantly important information regarding EEG signals. The EEG signals have chaotic behavior; the non-linear methods such as FD technique can extract important information from EEG data. The non-linear features extracted from the TQWT sub-bands based on FD method were Katz, Higuchi, and Petrosian, and hurst exponenet.
Higuchi’s method
Consider x(1),x(2),…, x(N) as the time sequence that should be examined. Create k new time series xmk defined by [12]:

, where [a] indicates integer part of a, k shows the discrete time interval between points, and m indicates the initial time value. For each created time series, the mean length Lm(k) is defined as [25]:

An average length k is computed for all time series with the same delay k as the mean of k length Lm(k) for m=1,…, k. For each k ranging from 1 to kmax, the procedure is repeated producing a sum of average length L(k) for each k as indicated below [12]:

The total average length for scale k, L(k) is proportional to k-D, where D is the FD by Higuchi method [12].
Katz’s method
The FD of a curve based on Katz’s method is defined as [12]:

where d is the estimated diameter as the distance between the first point of the sequence and the points of sequence that provides the farthest distance, and L is the total length of the curve. d can be expressed mathematically as [12]:
7) d = max (distance(1,i))
where i is the one that maximizes the distance with respect to the first point. The use of measurement units depends on the computed FDs which are different if the units are different. Katz’s approach tries to solve the problem by creating a general unit: the average distance between successive points a. Normalizing distances by this method can lead to [25]:
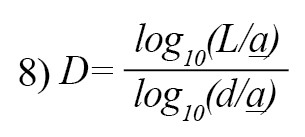
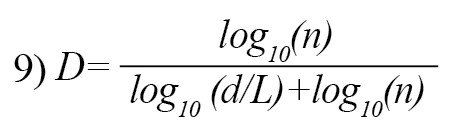
If n= L/a, where n is the number of steps in the curve, the above equation can be written as Equation 9 which summarizes the Katz’s approach for measuring DF of a EEG signal [12].
Petrosian method
The FD based on Petrosian method is defined as follows [12]:

where N∆ is the number of dissimilar pairs and n is the length of the sequence in the generated binary sequence [12].
Hurst Exponent
The equation of Hurst Exponent (HE) is as follows [26]:

where S is the standard deviation, T is the duration of sample data and R represents the difference between the minimum and maximum deviation from the mean.
Entropy features
Different entropy algorithms were used to extract the features of EEG signals
Shannon entropy
Shannon entropy is a fundamental entropy technique for feature extraction in EEG signals [26]. It is defined as follow:
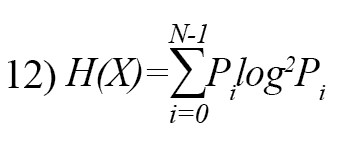
where Pi is the probability of occurrence of i-th symbol.
Log Energy entropy
The log energy entropy can be defined as [26]:

where K and denote the length of the EEG signal and ith sample of the EEG signal, respectively.
Sample entropy
The sample entropy is defined as [26]:
14) SampEn=-log(A/B)
Where A refers to the total number of vector pairs of length m + 1, and B shows the total number of vector pairs of length m.
Tsallis entropy
The tsallis entropy is defiend as [26]:

where the probability of occurrence is shown by En, and Pn is the feature value of the feature P that has the range of values from P1 to Px [26].
Fuzzy entropy
For a time series x(i), i={1,…..,N}, standard fuzzy entropy or FuzzyEn [27] establishes vector sequences{Xim,i=1,….,N-m+1} as defined below [26]:
16) Xim={x(i),x(i+1),…,x(i+m-1)}-x0 (i)
Where the length of sequences is denoted by m, and x0 (i) is a baseline.is the similarity degree using fuzzy membership function for the vector and replacing the Heaviside function [26].

where r and n are predefined gradient and width of the exponential function, and Dijm is the maximum absolute difference between Xim and Xjm.∅m .function is defined as follow [26]:

The sequences {Xi(m+1)} is generated by m ←m+1 setting m ←m+1 and ∅(m+1)(n,r) is constructed afterwards. Time series x(i) for input for FuzzyEn is generated ∅(m+1)(n,r) deviated from ∅(m+1)(n,r) as given below [26]:
19) FuzzyEn(m,n,t,N)=ln ∅m(n,r)-ln∅(m+1)(n,r)
Recurrence entropy
The recurrence entropy is defined as follow [26]:
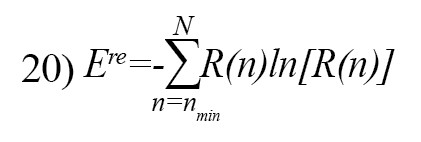
Where R(n) is the frequency distribution of the diagonal lines with length n [26].
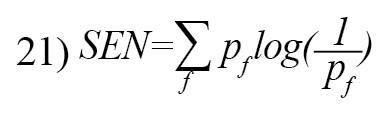
Spectral entropy
The Spectral Entropy (SEN) is defined as [26]:
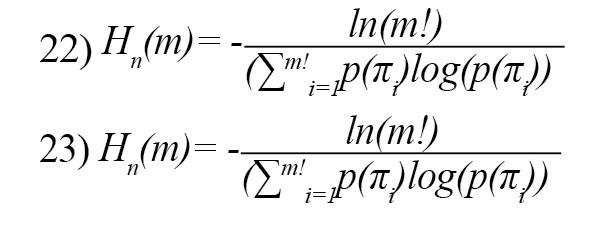
Graph entropy
The graph theory-based entropy is defined as follows [27]:
Feature reduction
Feature reduction is one of the important steps for disease diagnosis in the CAD system. The main goal of feature reduction is to apply important features to the inputs of classification algorithms [28]. This increases the classification speed and the accuracy of inputs [28]. Feature reduction is performed regularly with conventional ML and DL techniques. In this study, an AE model with 7 layers was used for feature reduction. Contrary to conventional techniques such as PCA, the feature reduction by AE method has higher performance [28]. Figure 5 shows the AE model with proposed layers. By this method, the number of features was reduced from 153 to 32.
.jpg) Classification
Classification
Support Vector Machine
SVM is one of the prominent classifiers used in ML. It creates an optimal margin hyperplane in the feature space that maximizes the margin between the nearest data points of each class and hyperplane. For linearly inseparable data, kernel functions are used to map the samples into a higher dimensional feature space where the data become linearly separable [29]. In this study, we used the GOA combined with the SVM classifier.
GOA algorithm
SVM is one of the most popular classification methods. By optimizing the important parameters of this method, including its kernels, the accuracy of the CAD system for diagnosing epilepsy can be improved. In this study we used the GOA algorithm for the optimization of SVM classification method. The model applied to simulate the behavior and movement of grasshoppers is defined as follows [21]:
24) mXi (t+1)=S1(t)+Gi(t)+Ai(t),
i=1,2,…,nPop t=1,2,…,tMax
where, is the position of the i-th grasshopper at the t-th iteration, is the social interaction of the i-th grasshopper at the t-th iteration shows the gravity force on the i-th grasshopper at the t-th iterationand indicates the wind advection on the i-th grasshopper at the t-th iteration
The social interaction of grasshopper is defined as [21]:
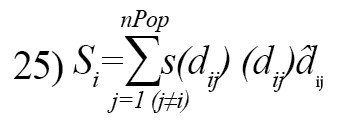
dij: The distance between the i-th and the j-th grasshopper, computed as dij=|x(i)-x(j)|
d̂ij: A unit vector from the i-th grasshopper to the j-th grasshopper, calculated as
S: A function to define the strength of social forces which is explained as follows:
26) s(d)=fe-e-d
where f is an indicator of the attraction intensity, and l is the attractive length scale. The s function demonstrates the impact of social interactions (repulsion and attraction) of grasshoppers. Figure 6 shows the primitive corrective patterns between individuals in a swarm of grasshoppers [21].
.jpg) The gravity force on the i-th grasshopper is defined as follows, where g is the gravity force and represents a unity vector towards the center of earth.
The gravity force on the i-th grasshopper is defined as follows, where g is the gravity force and represents a unity vector towards the center of earth.
27) Gi=-geg
The wind advection on the i-th grasshopper is calculated as follows, where u is the constant drift and is the unit vector of the wind [21]:
28) Ai=-uew
Now, according to the employed definitions, we can expand the Equation 24 as follows [21]:

The Equation 29 cannot be used in the optimization since it prevents the algorithm from exploring and exploiting decently in the search space around a solution. The second reason is that this equation is for outdoor modeling. To modify the Equation 29 and provide a functional model of the GOA algorithm to update the location of each grasshopper, we rewrite it as follows [21]:
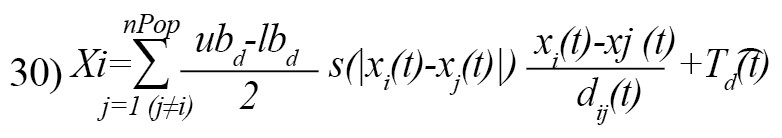
Where, is the upper bound in the D-th dimension, lbd is the lower bound in the D-th dimension, and is the value of the D-th the dimension in the target, and c is a decreasing coefficient [21]. Equation 31 defines the next position of the grasshopper [21]:
.jpg)
where, is the next position of the grasshopper i, is the current position of the grasshopper i, is the position of all other grasshoppers, and is the target position [21]. The parameter c is calculated as [21]:

where is the maximum value C (usually close to 1), is the minimum value C (usually close to +0), t is the current iteration, and tMax is the maximum iteration. The adaptive parameter c is used twice in Equation 32; the first c establishes a balance between exploration and exploitation. This c is highly resembling the w parameter in the PSO optimization algorithm. The second c reduces the attraction zone, comfort zone, and repulsion zone between grasshoppers (Equation 33) [21].

K-nearest neighbor
We also used the K-Nearest Neighbor (KNN) for feature classification. The KNN is a simple algorithm that store all available cases and classifies the new cases based on distance functions [31]. KNN is utilized in pattern recognition and statistical estimation as a non-parametric method. Majority vote of the neighbors is considered to classify a case. By meauring the distance function, a class is being assigned to a case. The advantages of KNN includes: (a) it is easy to implement and simple, (b) it can be used for regression and classification problems, and (c) there is no need to tune parameters, make extra assumptions or build a model. Howerev, its disadvantage is that as the number of independent variables or predictors increase, the performance of the algorithm decreses significantlly.
Random forest
The interpretability of DT method and their logical course of training have always attracted the attention of researchers, but one of the problems of this method is its quick overfitting. Random Forest (RF) is one of the methods to solve this problem. In this study, it was also used for classification of features. It has high accuracy, appropriate learning speed, and ability to separate data in high-dimensional spaces. By training different DTs and voting among them, these models become more robust to outliers and noises [31].
Validation
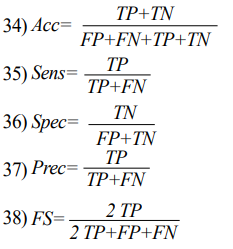
The classification results were evaluated using 10-fold cross validation method. The performance of the algorithm was estimated using metrics such as Specificity (Spec), Sensitivity (Sens), Accuracy (ACC), Precision (Prec), and F1-Score (FS) whose equations are presented below. These terminologies are extracted from confusion matrix which consists of True Positive (TP), False Negative (FN), True Negative (TN) and False Positive (FP) [22].
Results
In this study, in order to implement the proposed method for detection of epileptic seizures, a system with 16 GB RAM, Nvidia GeForce GTX 1070, and Intel Core i7 was used. The preprocessing and feature extraction were conducted in MATLAB 2019a. The the AE method and classification techniques were implemented using Python, Keras, and Scikit-learn softwares [3, 34]. In the proposed method, the Bonn dataset was used for the diagnosis of epileptic seizures. As indicated in Table 2, we used six different classification problems. First, the EEG signals from the Bonn dataset were decomposed into 5-second time windows. Then, the TQWT was used for signal decomposition into different frequency sub-bands. Next, different statistical and non-linear features were extracted from the TQWT sub-bands. In this regard, 153 features were extracted. The AE method with 7 layers was used for feature reduction. By this method, the number of features was reduced to 32. At the end, different algorithms were used for classification.
When optimization algorithms such as medical data classification are used in ML, researchers often perform the method several times in a same conditions to obtain valid results. In this regard, we performed all classification algorithms 10 times in a exactly same conditions to obtain valid results. The results of each classification algorithm for different modes are presented in Table 4.
.jpg)
According to the results, by using the GOA/SVM method, higher accuracy was obtained compared to other classification algorithms.
Discussion and Conclusion
Epilepsy is a brain disorder, which is known as a neurological disorder and causes seizures or abnormal behavior, emotions, and sometimes anesthesia [1, 2, 3, 4]. One of the most commonly used functional neuroimaging methods fro the diagnosis of epileptic seizures is EEG. It can find the exact location of epilepsy, and its recording is less expensive than other neuroimaging methods [1, 2, 3, 4]. EEG signals cause some challenges for physicians despite their advantages. EEG recording is conducted in a long-term period to detect epileptic seizures, which challenges physicians for accurately locating the disease. Epileptic seizures are difficult to diagnose because EEG images often contain a variety of internal and external abnormalities. A novel method for epileptic seizure detection was presented in this study based on ML and DL techniques to overcome these challenges. Preprocessing of TQWT subbands, extraction of statistical and nonlinear features, feature reduction by a DL-based AE method, and classification by the GOA/SVM model were used in this study to detect epileptic seizures from EEG signals. Adopting the features extracted in this study improved the accuracy of epileptic seizures detection. Table 5 compares the results of the proposed method with other methods used EEG signals for epileptic seizures detection.
.jpg)
The results of the proposed method were more accurate than other methods due to proper preprocessing, feature extraction, feature selection, and classification. The proposed method can be implemented in a hardware or software to help physicians detect epileptic seizures. Future research can focus on new techniques of DL such as attention learning, graph, and q-learning for epileptic seizures detection using EEG signals [56, 57, 58, 59, 60]. Deep feature fusion techniques can also be used in future studies, as well a the combination of handcrafted features with DL techniques for epileptic seizures detection [61, 62, 63].
Ethical Considerations
Compliance with ethical guidelines
No ethical approval was needed, since no any experiment on human or anaimal samples were conducted.
Funding
The paper was extracted from the PhD. dissertation by Anis Malekzadeh/Assef Zare/Mehdi Yaghoubi, at Department of Electrical, Technical Engineering, Islamic Azad University.
Authors' contributions
All authors equally contributed to preparing this article.
Conflicts of interest
The authors declared no conflict of interest.
Acknowledgments
The authors would like to thank the Deputy for Research of Islamic Azad University of Gonabad branch for their cooperation.
References
Epilepsy is a chronic noncommunicable neurological disorder which can affect people at any age [1]. It is a common brain disease and approximately 50 million people wordwide are suffering from it. Eighty percent of patients with this disease live in low- or middle-income countries. Seventy percent of these patients can have a seizure-free life if treated and diagnosed properly. The risk of premature death is three times higher in these patients than in general population. Three quarters of epilepsy patients dwelling in developing countries cannot afford to recive treatment [2]. These patients and their families suffer from discrimination and stigma. Generalized-onset and focal-onset seizures are two types of epilepsy [3]. Focal epilepsy affects one area of the brain. It is important to locate that area of the brain for proper medical attention. It is estimated that 60% of patients with focal epilepsy and 20% of those with generalized epilepsy become resistant to drugs and need surgery [4].
Various methods for epileptic seizure detection have been provided so far, including clinical methods and neuroimaging modalities; the latter are widely used by physicians [1, 2]. Generally, neuroimaging modalities are categorized into functional and structural modalities [1 ,2, 3]. Electroencephalography (EEG) is a functional neuroimaging modality for epileptic seizure detection [1, 2]. EEG signals provide essential information from the affected area which helps physicians to detect epileptic seizures with a higher accuracy [1 ,2, 3]. The diagnosis of epileptic seizures by EEG signals is a challenging task for physicians [1, 2]. The EEG signals are accompanied by relatively high complexity, which makes it difficult or challenging to correctly diagnose epile seizures [1, 2]. Accordingly, researchers have attempted to use Artificial Intelligence (AI) including Machine Learning (ML) [4 ,5, 6] and Deep Learning (DL) [7, 8] to diagnose epileptic seizures early via EEG signals. In ML-based Computer-Aided Diagnosis (CAD) system, the feature extraction techniques include time [9], frequency [10], time-frequency [11], and non-linear methods [12]. In DL-based CAD system, the methods for epileptic seizures detection include Autoencoders (AEs) [13, 14], Recurrent Neural Networks (RNNs) [15, 16], Convolutional Neural Networks (CNNs) [17, 18], and Deep Belief Networks (DBNs) [19].
Abedin et al. [45] provided an epileptic seizure detection method based on statistical features and achieved promising results. They first used a Bonn dataset and Discrete Wavelet Transform (DWT) method to preprocess and analyze EEG signals based on different sub-bands. Then, each DWT sub-band was examined to extract some statistical properties, and Artificial Neural Network (ANN) was employed for data classification. Singh et al. [48] proposed a new method for epileptic seizure detection from Bonn EEG dataset. They used Complete Ensemble Empirical Mode Decomposition (CEEMD) and Refined Composite Multiscale Dispersion Entropy (RCMDE) methods to conduct preprocessing and extract properties, and tested various methods for feature selection to reduce the size of the feature matrix. Finally, the ANN classifier technique was applied which led to promising outcomes. Aliyu et al. [49] presented an epileptic seizure detection method by selecting optimal wavelet transforms. To analyze EEG data, DWT was used to break them down into multiple sub-bands and extract various statistical information from each one. As a result, Correlation Coefficient and P-value (CCP) feature and Principal Component Analysis (PCA) were used to minimize the specificity. A Long Short-Term Memory (LSTM) model with the proposed layers was applied to categorize the inputs, resulted in 99% accuracy. Sameer and Gupta [50] considered Haralick texture features to present a method for detecting epileptic seizures from EEG signals, converted to two-dimensional images using Short-Time Fourier Transform (STFT) to extract Haralick texture features. Finally, the Decision Tree (DT) method was applied for categorization. The results reported 92.50% accuracy. Qureshi et al. [51] utilized Fractal Dimension (FD) and graph theories for feature extraction and used Electroconvulsive Therapy (ECT) for EEG signals pre-processing as the first stage of the study. Then, they extracted graph theory and FD-based features from EEG signals. Finally, they applied the Radio-Frequency (RF) method for classification and reached 98.50% accuracy.
The current study provides a novel method based on the extraction of statistical and non-linear features, feature reduction, and classification by the Grasshopper Optimization Algorithm and Support Vector Machines (GOA/SVM) model. The Bonn EEG dataset was used for epileptic seizures detection. Figure 1 illustrates the proposed method for epileptic seizure detection from EEG signals.
2. Material and Methods
In this section, the proposed method for epileptic seizures detection in EEG signals is presented at following steps: Data selection, preprocessing, feature extraction, feature reduction, and classification.
Data seelction
The Bonn dataset was used in this study which has been recorded at the University of Bonn by a group of researchers and it had been widely used for epileptic seizure analysis and detection [22]. Bonn dataset is a publicly available dataset containing 500 single-channel EEG data. It was sampled at 173.6 Hz for 23.6 seconds. They consisted of five classes’ viz. S, F, N, O, and Z with 100 segments recordings in each class [22]. The O and Z data were collected from 5 healthy controls in a relaxed postion and awake state and using the 10-20 electrode placement standard. Intracranial electrodes were used on 5 patients with epilepsy to collect data of S, F and N classes. The epileptogenic zone and the opposite hemisphere were used for recording the signals of F and S classes, respectively during interictal period. Ictal period was taken into account for recording the signals of class S. Cutoff frequencies in the range of 0.53-40 Hz were applied with finite impulse response and 20 order band-pass filter for filtering of EEG data [22]. Figure 2 shows the EEG signals of the Bonn dataset.
Preprocessing
For pre-processing of the EEG signals, the TQWT was used. It is a special type of DWT and is used in biomedical signal studies [20]. In TQWT, parameters include the redundancy, number of decomposition levels and Q-factor. Oscillatory signals are analyzed using higher Q-factors and transients are analyzed with lower Q-factors. The two-channel filter bank is applied for implementing TQWT. Low- and high-pass scale factors for this filter banks are represented by γ and δ. The mathematical expression for the frequency response to low-pass filter and high-pass filter are presented in Equations 1 and 2, respectively [20]:
For further information regarding the TQWT, see reference [20]. The TQWT parameters were selected similar to those reported in Ghassemi et al.’s study [34] (Q= 1, r = 3, and J= 8). In Figure 3, the TQWT sub-bands are illustrated based on the defined parameters.
In this section, we presented different feature extraction methods for epileptic seizures detection. Frist, the TQWT was used for EEG signals decomposition. Different features such as statistical features, non-linear features based on FD method and non-linear features based on entropy algorithms were extracted from the TQWT sub-bands.
Statistical features
Five statistical features were extracted from the TQWT subbands [23] presented in Table 3.
FD-based features
The FD-based non-linear features provide significantly important information regarding EEG signals. The EEG signals have chaotic behavior; the non-linear methods such as FD technique can extract important information from EEG data. The non-linear features extracted from the TQWT sub-bands based on FD method were Katz, Higuchi, and Petrosian, and hurst exponenet.
Higuchi’s method
Consider x(1),x(2),…, x(N) as the time sequence that should be examined. Create k new time series xmk defined by [12]:
, where [a] indicates integer part of a, k shows the discrete time interval between points, and m indicates the initial time value. For each created time series, the mean length Lm(k) is defined as [25]:
An average length k is computed for all time series with the same delay k as the mean of k length Lm(k) for m=1,…, k. For each k ranging from 1 to kmax, the procedure is repeated producing a sum of average length L(k) for each k as indicated below [12]:
The total average length for scale k, L(k) is proportional to k-D, where D is the FD by Higuchi method [12].
Katz’s method
The FD of a curve based on Katz’s method is defined as [12]:
where d is the estimated diameter as the distance between the first point of the sequence and the points of sequence that provides the farthest distance, and L is the total length of the curve. d can be expressed mathematically as [12]:
7) d = max (distance(1,i))
where i is the one that maximizes the distance with respect to the first point. The use of measurement units depends on the computed FDs which are different if the units are different. Katz’s approach tries to solve the problem by creating a general unit: the average distance between successive points a. Normalizing distances by this method can lead to [25]:
If n= L/a, where n is the number of steps in the curve, the above equation can be written as Equation 9 which summarizes the Katz’s approach for measuring DF of a EEG signal [12].
Petrosian method
The FD based on Petrosian method is defined as follows [12]:
where N∆ is the number of dissimilar pairs and n is the length of the sequence in the generated binary sequence [12].
Hurst Exponent
The equation of Hurst Exponent (HE) is as follows [26]:
where S is the standard deviation, T is the duration of sample data and R represents the difference between the minimum and maximum deviation from the mean.
Entropy features
Different entropy algorithms were used to extract the features of EEG signals
Shannon entropy
Shannon entropy is a fundamental entropy technique for feature extraction in EEG signals [26]. It is defined as follow:
where Pi is the probability of occurrence of i-th symbol.
Log Energy entropy
The log energy entropy can be defined as [26]:
where K and denote the length of the EEG signal and ith sample of the EEG signal, respectively.
Sample entropy
The sample entropy is defined as [26]:
14) SampEn=-log(A/B)
Where A refers to the total number of vector pairs of length m + 1, and B shows the total number of vector pairs of length m.
Tsallis entropy
The tsallis entropy is defiend as [26]:
where the probability of occurrence is shown by En, and Pn is the feature value of the feature P that has the range of values from P1 to Px [26].
Fuzzy entropy
For a time series x(i), i={1,…..,N}, standard fuzzy entropy or FuzzyEn [27] establishes vector sequences{Xim,i=1,….,N-m+1} as defined below [26]:
16) Xim={x(i),x(i+1),…,x(i+m-1)}-x0 (i)
Where the length of sequences is denoted by m, and x0 (i) is a baseline.is the similarity degree using fuzzy membership function for the vector and replacing the Heaviside function [26].
where r and n are predefined gradient and width of the exponential function, and Dijm is the maximum absolute difference between Xim and Xjm.∅m .function is defined as follow [26]:
The sequences {Xi(m+1)} is generated by m ←m+1 setting m ←m+1 and ∅(m+1)(n,r) is constructed afterwards. Time series x(i) for input for FuzzyEn is generated ∅(m+1)(n,r) deviated from ∅(m+1)(n,r) as given below [26]:
19) FuzzyEn(m,n,t,N)=ln ∅m(n,r)-ln∅(m+1)(n,r)
Recurrence entropy
The recurrence entropy is defined as follow [26]:
Where R(n) is the frequency distribution of the diagonal lines with length n [26].
Spectral entropy
The Spectral Entropy (SEN) is defined as [26]:
Graph entropy
The graph theory-based entropy is defined as follows [27]:
Feature reduction
Feature reduction is one of the important steps for disease diagnosis in the CAD system. The main goal of feature reduction is to apply important features to the inputs of classification algorithms [28]. This increases the classification speed and the accuracy of inputs [28]. Feature reduction is performed regularly with conventional ML and DL techniques. In this study, an AE model with 7 layers was used for feature reduction. Contrary to conventional techniques such as PCA, the feature reduction by AE method has higher performance [28]. Figure 5 shows the AE model with proposed layers. By this method, the number of features was reduced from 153 to 32.
Support Vector Machine
SVM is one of the prominent classifiers used in ML. It creates an optimal margin hyperplane in the feature space that maximizes the margin between the nearest data points of each class and hyperplane. For linearly inseparable data, kernel functions are used to map the samples into a higher dimensional feature space where the data become linearly separable [29]. In this study, we used the GOA combined with the SVM classifier.
GOA algorithm
SVM is one of the most popular classification methods. By optimizing the important parameters of this method, including its kernels, the accuracy of the CAD system for diagnosing epilepsy can be improved. In this study we used the GOA algorithm for the optimization of SVM classification method. The model applied to simulate the behavior and movement of grasshoppers is defined as follows [21]:
24) mXi (t+1)=S1(t)+Gi(t)+Ai(t),
i=1,2,…,nPop t=1,2,…,tMax
where, is the position of the i-th grasshopper at the t-th iteration, is the social interaction of the i-th grasshopper at the t-th iteration shows the gravity force on the i-th grasshopper at the t-th iterationand indicates the wind advection on the i-th grasshopper at the t-th iteration
The social interaction of grasshopper is defined as [21]:
dij: The distance between the i-th and the j-th grasshopper, computed as dij=|x(i)-x(j)|
d̂ij: A unit vector from the i-th grasshopper to the j-th grasshopper, calculated as
S: A function to define the strength of social forces which is explained as follows:
26) s(d)=fe-e-d
where f is an indicator of the attraction intensity, and l is the attractive length scale. The s function demonstrates the impact of social interactions (repulsion and attraction) of grasshoppers. Figure 6 shows the primitive corrective patterns between individuals in a swarm of grasshoppers [21].
27) Gi=-geg
The wind advection on the i-th grasshopper is calculated as follows, where u is the constant drift and is the unit vector of the wind [21]:
28) Ai=-uew
Now, according to the employed definitions, we can expand the Equation 24 as follows [21]:
The Equation 29 cannot be used in the optimization since it prevents the algorithm from exploring and exploiting decently in the search space around a solution. The second reason is that this equation is for outdoor modeling. To modify the Equation 29 and provide a functional model of the GOA algorithm to update the location of each grasshopper, we rewrite it as follows [21]:
Where, is the upper bound in the D-th dimension, lbd is the lower bound in the D-th dimension, and is the value of the D-th the dimension in the target, and c is a decreasing coefficient [21]. Equation 31 defines the next position of the grasshopper [21]:
where, is the next position of the grasshopper i, is the current position of the grasshopper i, is the position of all other grasshoppers, and is the target position [21]. The parameter c is calculated as [21]:
where is the maximum value C (usually close to 1), is the minimum value C (usually close to +0), t is the current iteration, and tMax is the maximum iteration. The adaptive parameter c is used twice in Equation 32; the first c establishes a balance between exploration and exploitation. This c is highly resembling the w parameter in the PSO optimization algorithm. The second c reduces the attraction zone, comfort zone, and repulsion zone between grasshoppers (Equation 33) [21].
K-nearest neighbor
We also used the K-Nearest Neighbor (KNN) for feature classification. The KNN is a simple algorithm that store all available cases and classifies the new cases based on distance functions [31]. KNN is utilized in pattern recognition and statistical estimation as a non-parametric method. Majority vote of the neighbors is considered to classify a case. By meauring the distance function, a class is being assigned to a case. The advantages of KNN includes: (a) it is easy to implement and simple, (b) it can be used for regression and classification problems, and (c) there is no need to tune parameters, make extra assumptions or build a model. Howerev, its disadvantage is that as the number of independent variables or predictors increase, the performance of the algorithm decreses significantlly.
Random forest
The interpretability of DT method and their logical course of training have always attracted the attention of researchers, but one of the problems of this method is its quick overfitting. Random Forest (RF) is one of the methods to solve this problem. In this study, it was also used for classification of features. It has high accuracy, appropriate learning speed, and ability to separate data in high-dimensional spaces. By training different DTs and voting among them, these models become more robust to outliers and noises [31].
Validation
The classification results were evaluated using 10-fold cross validation method. The performance of the algorithm was estimated using metrics such as Specificity (Spec), Sensitivity (Sens), Accuracy (ACC), Precision (Prec), and F1-Score (FS) whose equations are presented below. These terminologies are extracted from confusion matrix which consists of True Positive (TP), False Negative (FN), True Negative (TN) and False Positive (FP) [22].
Results
In this study, in order to implement the proposed method for detection of epileptic seizures, a system with 16 GB RAM, Nvidia GeForce GTX 1070, and Intel Core i7 was used. The preprocessing and feature extraction were conducted in MATLAB 2019a. The the AE method and classification techniques were implemented using Python, Keras, and Scikit-learn softwares [3, 34]. In the proposed method, the Bonn dataset was used for the diagnosis of epileptic seizures. As indicated in Table 2, we used six different classification problems. First, the EEG signals from the Bonn dataset were decomposed into 5-second time windows. Then, the TQWT was used for signal decomposition into different frequency sub-bands. Next, different statistical and non-linear features were extracted from the TQWT sub-bands. In this regard, 153 features were extracted. The AE method with 7 layers was used for feature reduction. By this method, the number of features was reduced to 32. At the end, different algorithms were used for classification.
When optimization algorithms such as medical data classification are used in ML, researchers often perform the method several times in a same conditions to obtain valid results. In this regard, we performed all classification algorithms 10 times in a exactly same conditions to obtain valid results. The results of each classification algorithm for different modes are presented in Table 4.
According to the results, by using the GOA/SVM method, higher accuracy was obtained compared to other classification algorithms.
Discussion and Conclusion
Epilepsy is a brain disorder, which is known as a neurological disorder and causes seizures or abnormal behavior, emotions, and sometimes anesthesia [1, 2, 3, 4]. One of the most commonly used functional neuroimaging methods fro the diagnosis of epileptic seizures is EEG. It can find the exact location of epilepsy, and its recording is less expensive than other neuroimaging methods [1, 2, 3, 4]. EEG signals cause some challenges for physicians despite their advantages. EEG recording is conducted in a long-term period to detect epileptic seizures, which challenges physicians for accurately locating the disease. Epileptic seizures are difficult to diagnose because EEG images often contain a variety of internal and external abnormalities. A novel method for epileptic seizure detection was presented in this study based on ML and DL techniques to overcome these challenges. Preprocessing of TQWT subbands, extraction of statistical and nonlinear features, feature reduction by a DL-based AE method, and classification by the GOA/SVM model were used in this study to detect epileptic seizures from EEG signals. Adopting the features extracted in this study improved the accuracy of epileptic seizures detection. Table 5 compares the results of the proposed method with other methods used EEG signals for epileptic seizures detection.
The results of the proposed method were more accurate than other methods due to proper preprocessing, feature extraction, feature selection, and classification. The proposed method can be implemented in a hardware or software to help physicians detect epileptic seizures. Future research can focus on new techniques of DL such as attention learning, graph, and q-learning for epileptic seizures detection using EEG signals [56, 57, 58, 59, 60]. Deep feature fusion techniques can also be used in future studies, as well a the combination of handcrafted features with DL techniques for epileptic seizures detection [61, 62, 63].
Ethical Considerations
Compliance with ethical guidelines
No ethical approval was needed, since no any experiment on human or anaimal samples were conducted.
Funding
The paper was extracted from the PhD. dissertation by Anis Malekzadeh/Assef Zare/Mehdi Yaghoubi, at Department of Electrical, Technical Engineering, Islamic Azad University.
Authors' contributions
All authors equally contributed to preparing this article.
Conflicts of interest
The authors declared no conflict of interest.
Acknowledgments
The authors would like to thank the Deputy for Research of Islamic Azad University of Gonabad branch for their cooperation.
References
- Shoeibi A, Khodatars M, Ghassemi N, Jafari M, Moridian P, Alizadehsani R, et al. Epileptic seizures detection using deep learning techniques: A review. International Journal of Environmental Research and Public Health. 2021; 18(11):5780. [DOI:10.3390/ijerph18115780] [PMID] [PMCID]
- Shoeibi A, Ghassemi N, Khodatars M, Jafari M, Moridian P, Alizadehsani R, et al. Applications of epileptic seizures detection in neuroimaging modalities using deep learning techniques: Methods, challenges, and future works. arXiv preprint arXiv:2105.14278. 2021. https://arxiv.org/pdf/2105.14278.pdf
- Subasi A. Epileptic seizure detection using dynamic wavelet network. Expert Systems with Applications. 2005; 29(2):343-55. [DOI:10.1016/j.eswa.2005.04.007]
- Subasi A, Erçelebi E, Alkan A, Koklukaya E. Comparison of subspace-based methods with AR parametric methods in epileptic seizure detection. Computers in Biology and Medicine. 2006; 36(2):195-208. [DOI:10.1016/j.compbiomed.2004.11.001] [PMID]
- Alizadehsani R, Roshanzamir M, Hussain S, Khosravi A, Koohestani A, Zangooei MH, et al. Handling of uncertainty in medical data using machine learning and probability theory techniques: A review of 30 years (1991–2020). Annals of Operations Research. 2021:1-42. [DOI:10.1007/s10479-021-04006-2] [PMID] [PMCID]
- Siddiqui MK, Morales-Menendez R, Huang X, Hussain N. A review of epileptic seizure detection using machine learning classifiers. Brain Informatics. 2020; 7(1):5. [DOI:10.1186/s40708-020-00105-1] [PMID] [PMCID]
- Piccialli F, Di Somma V, Giampaolo F, Cuomo S, Fortino G. A survey on deep learning in medicine: Why, how and when? Information Fusion. 2021; 66:111-37. [DOI:10.1016/j.inffus.2020.09.006]
- Akay A, Hess H. Deep learning: Current and emerging applications in medicine and technology. IEEE Journal of Biomedical and Health Informatics. 2019; 23(3):906-20. [DOI:10.1109/JBHI.2019.2894713] [PMID]
- Srinivasan V, Eswaran C, Sriraam N. Artificial neural network based epileptic detection using time-domain and frequency-domain features. Journal of Medical Systems. 2005; 29(6):647-60. [DOI:10.1007/s10916-005-6133-1] [PMID]
- Faust O, Acharya UR, Min LC, Sputh BH. Automatic identification of epileptic and background EEG signals using frequency domain parameters. International Journal of Neural Systems. 2010; 20(2):159-76. [DOI:10.1142/S0129065710002334] [PMID]
- Li M, Sun X, Chen W, Jiang Y, Zhang T. Classification epileptic seizures in EEG using time-frequency image and block texture features. IEEE Access. 2019; 8:9770-81. [DOI:10.1109/ACCESS.2019.2960848]
- Yuan Q, Zhou W, Liu Y, Wang J. Epileptic seizure detection with linear and nonlinear features. Epilepsy & Behavior. 2012; 24(4):415-21. [DOI:10.1016/j.yebeh.2012.05.009] [PMID]
- Goodfellow I, Bengio Y, Courville A. Deep learning. United States: MIT press; 2016. https://books.google.com/books/about/Deep_Learning.html?id=Np9SDQAAQBAJ
- Emami A, Kunii N, Matsuo T, Shinozaki T, Kawai K, Takahashi H. Autoencoding of long-term scalp electroencephalogram to detect epileptic seizure for diagnosis support system. Computers in Biology and Medicine. 2019; 110:227-33. [DOI:10.1016/j.compbiomed.2019.05.025] [PMID]
- Jaafar ST, Mohammadi M. Epileptic seizure detection using deep learning approach. UHD Journal of Science and Technology. 2019; 3(2):41-50. [DOI:10.21928/uhdjst.v3n2y2019.pp41-50]
- Shahbazi M, Aghajan H. A generalizable model for seizure prediction based on deep learning using CNN-LSTM architecture. IEEE Global Conference on Signal and Information Processing (GlobalSIP), 2018 Nov 26, Anaheim, CA, USA. [DOI:10.1109/GlobalSIP.2018.8646505]
- Truong ND, Kavehei O. Low precision electroencephalogram for seizure detection with convolutional neural network. IEEE International Conference on Artificial Intelligence Circuits and Systems (AICAS), 2019 Mar 18, Taiwan. [DOI:10.1109/AICAS.2019.8771569]
- Zhou M, Tian C, Cao R, Wang B, Niu Y, Hu T, et al. Epileptic seizure detection based on EEG signals and CNN. Frontiers in Neuroinformatics. 2018; 12:95. [DOI:10.3389/fninf.2018.00095] [PMID] [PMCID]
- Movahedi F, Coyle JL, Sejdić E. Deep belief networks for electroencephalography: A review of recent contributions and future outlooks. IEEE Journal of Biomedical and Health Informatics. 2017; 22(3):642-52. [DOI:10.1109/JBHI.2017.2727218] [PMID] [PMCID]
- Selesnick IW. Wavelet transform with tunable Q-factor. IEEE Transactions on Signal Processing. 2011; 59(8):3560-75. [DOI:10.1109/TSP.2011.2143711]
- Abualigah L, Diabat A. A comprehensive survey of the Grasshopper optimization algorithm: Results, variants, and applications. Neural Computing and Applications. 2020; 32(19):15533-56. [DOI:10.1007/s00521-020-04789-8].
- Department of Epileptology University of Bonn. EEG time series data. Bonn: Department of Epileptology University of Bonn, Germany; 2015. http://epileptologie-bonn.de/cms/front_content.php?idcat=193&lang=3&changelang=3 [accessed September, 2015]
- Sameer M, Gupta B. Detection of epileptical seizures based on alpha band statistical features. Wireless Personal Communications. 2020; 115(2):909-25. [DOI:10.1007/s11277-020-07852-8]
- Esteller R, Vachtsevanos G, Echauz J, Litt B. A comparison of waveform fractal dimension algorithms. IEEE Transactions on Circuits and Systems I: Fundamental Theory and Applications. 2001; 48(2):177-83. [DOI:10.1109/81.904882]
- Madan S, Srivastava K, Sharmila A, Mahalakshmi P. A case study on Discrete Wavelet Transform based Hurst exponent for epilepsy detection. Journal of Medical Engineering & Technology. 2018; 42(1):9-17. [DOI:10.1080/03091902.2017.1394390] [PMID]
- Acharya UR, Hagiwara Y, Koh JE, Oh SL, Tan JH, Adam M, et al. Entropies for automated detection of coronary artery disease using ECG signals: A review. Biocybernetics and Biomedical Engineering. 2018; 38(2):373-84. [DOI:10.1016/j.bbe.2018.03.001]
- Mohammadpoory Z, Nasrolahzadeh M, Haddadnia J. Epileptic seizure detection in EEGs signals based on the weighted visibility graph entropy. Seizure. 2017; 50:202-8. [DOI:10.1016/j.seizure.2017.07.001] [PMID]
- Wang Y, Yao H, Zhao S. Auto-encoder based dimensionality reduction. Neurocomputing. 2016; 184:232-42. [DOI:10.1016/j.neucom.2015.08.104]
- William SN, Teukolsky SA. What is a support vector machine. Nat Biotechnol. 2006; 24(12):1565-7. [DOI:10.1038/nbt1206-1565] [PMID]
- Keller JM, Gray MR, Givens JA. A fuzzy k-nearest neighbor algorithm. IEEE Transactions on Systems, Man, and Cybernetics. 1985; 15(4):258-63. [DOI:10.1109/TSMC.1985.6313426]
- Oshiro TM, Perez PS, Baranauskas JA. How many trees in a random forest? International workshop on machine learning and data mining in pattern recognition. Berlin, Heidelberg: Springer; 2012. [DOI:10.1007/978-3-642-31537-4_13]
- Ketkar N. Introduction to GPUs. Deep learning with Python. 1th ed. Berkeley, CA: Apress; 2017. [DOI:10.1007/978-1-4842-2766-4_10]
- Pedregosa F, Varoquaux G, Gramfort A, Michel V, Thirion B, Grisel O, et al. Scikit-learn: Machine learning in Python. The Journal of Machine Learning Research. 2011; 12:2825-30. https://www.jmlr.org/papers/volume12/pedregosa11a/pedregosa11a.pdf?ref=https://githubhelp.com
- Ghassemi N, Shoeibi A, Rouhani M, Hosseini-Nejad H. Epileptic seizures detection in EEG signals using TQWT and ensemble learning. 9th International Conference on Computer and Knowledge Engineering (ICCKE), 2019 Oct 24, Mashhad, Iran. [DOI:10.1109/ICCKE48569.2019.8964826]
- Nishad A, Pachori RB. Classification of epileptic electroencephalogram signals using tunable-Q wavelet transform based filter-bank. Journal of Ambient Intelligence and Humanized Computing. 2020. [DOI:10.1007/s12652-020-01722-8]
- Sharaf AI, El-Soud MA, El-Henawy IM. An automated approach for epilepsy detection based on tunable Q-wavelet and firefly feature selection algorithm. International Journal of Biomedical Imaging. 2018; 2018:5812872. [DOI:10.1155/2018/5812872] [PMID] [PMCID]
- Gupta V, Bhattacharyya A, Pachori RB. Classification of seizure and non-seizure EEG signals based on EMD-TQWT method. 22nd International Conference on Digital Signal Processing (DSP), 2017 Aug 23, London, United Kingdom. [DOI:10.1109/ICDSP.2017.8096036]
- Reddy GR, Rao R. Automated identification system for seizure EEG signals using tunable-Q wavelet transform. Engineering Science and Technology, an International Journal. 2017; 20(5):1486-93. [DOI:10.1016/j.jestch.2017.11.003]
- Ramos-Aguilar R, Olvera-López JA, Olmos-Pineda I, Sánchez-Urrieta S. Feature extraction from EEG spectrograms for epileptic seizure detection. Pattern Recognition Letters. 2020; 133:202-9. [DOI:10.1016/j.patrec.2020.03.006]
- Chen S, Zhang X, Chen L, Yang Z. Automatic diagnosis of epileptic seizure in electroencephalography signals using nonlinear dynamics features. IEEE Access. 2019; 7:61046-56. [DOI:10.1109/ACCESS.2019.2915610]
- Tuncer T, Dogan S, Akbal E. A novel local senary pattern based epilepsy diagnosis system using EEG signals. Australasian Physical & Engineering Sciences in Medicine. 2019; 42(4):939-48. [DOI:10.1007/s13246-019-00794-x] [PMID]
- Gupta V, Pachori RB. Epileptic seizure identification using entropy of FBSE based EEG rhythms. Biomedical Signal Processing and Control. 2019; 53:101569. [DOI:10.1016/j.bspc.2019.101569]
- Raghu S, Sriraam N, Hegde AS, Kubben PL. A novel approach for classification of epileptic seizures using matrix determinant. Expert Systems with Applications. 2019; 127:323-41. [DOI:10.1016/j.eswa.2019.03.021]
- Sharma S, Bhatia V, Gupta A. Noncoherent IR-UWB receiver using massive antenna arrays for wireless sensor networks. IEEE Sensors Letters. 2017; 2(1):1-4. [DOI:10.1109/LSENS.2017.2778430]
- Abedin MZ, Akther S, Hossain MS. An artificial neural network model for epilepsy seizure detection. 5th International Conference on Advances in Electrical Engineering (ICAEE) 2019 Sep 26, Dhaka, Bangladesh. [DOI:10.1109/ICAEE48663.2019.8975569]
- Tzimourta KD, Tzallas AT, Giannakeas N, Astrakas LG, Tsalikakis DG, Angelidis P, et al. A robust methodology for classification of epileptic seizures in EEG signals. Health and Technology. 2019; 9(2):135-42. [DOI:10.1007/s12553-018-0265-z]
- Singh G, Kaur M, Singh B. Detection of epileptic seizure EEG signal using multiscale entropies and complete ensemble empirical mode decomposition. Wireless Personal Communications. 2021; 116(1):845-64. [DOI:10.1007/s11277-020-07742-z]
- Liu Y, Jiang B, Feng J, Hu J, Zhang H. Classification of EEG signals for epileptic seizures using feature dimension reduction algorithm based on LPP. Multimedia Tools and Applications. 2021; 80(20):30261-82. [DOI:10.1007/s11042-020-09135-7]
- Aliyu I, Lim CG. Selection of optimal wavelet features for epileptic EEG signal classification with LSTM. Neural Computing and Applications. 2021. [DOI:10.1007/s00521-020-05666-0]
- Sameer M, Gupta B. Beta band as a biomarker for classification between interictal and ictal states of epileptical patients. 7th International Conference on Signal Processing and Integrated Networks (SPIN), 2020 Feb 27, Noida, India. [DOI:10.1109/SPIN48934.2020.9071343]
- Qureshi MB, Afzaal M, Qureshi MS, Fayaz M. Machine learning-based EEG signals classification model for epileptic seizure detection. Multimedia Tools and Applications. 2021; 80(12):17849-77. [DOI:10.1007/s11042-021-10597-6]
- Al-Hadeethi H, Abdulla S, Diykh M, Deo RC, Green JH. Adaptive boost LS-SVM classification approach for time-series signal classification in epileptic seizure diagnosis applications. Expert Systems with Applications. 2020; 161:113676. [DOI:10.1016/j.eswa.2020.113676]
- Whitley D. A genetic algorithm tutorial. Statistics and Computing. 1994; 4(2):65-85. [DOI:10.1007/BF00175354]
- Zhou C, Gao HB, Gao L, Zhang WG. Particle swarm optimization (PSO)algorithm. Application Research of Computers. 2003; 12:7-11.
- Settles M, Soule T. Breeding swarms: A GA/PSO hybrid. 7th annual conference on genetic and evolutionary computation, 2005 Jun 25, New York, United States. [DOI:10.1145/1068009.1068035]
- Khodatars M, Shoeibi A, Sadeghi D, Ghassemi N, Jafari M, Moridian P, et al. Deep learning for neuroimaging-based diagnosis and rehabilitation of autism spectrum disorder: A review. Computers in Biology and Medicine. 2021; 139:104949 [DOI:10.1016/j.compbiomed.2021.104949] [PMID]
- Shoeibi A, Sadeghi D, Moridian P, Ghassemi N, Heras J, Alizadehsani R, et al. Automatic diagnosis of schizophrenia using EEG signals and CNN-LSTM models. Frontiers in Neuroinformatics. 2021; 15:777977 [DOI:10.3389/fninf.2021.777977] [PMID] [PMCID]
- Shoeibi A, Khodatars M, Jafari M, Moridian P, Rezaei M, Alizadehsani R, et al. Applications of deep learning techniques for automated multiple sclerosis detection using magnetic resonance imaging: A review. Computers in Biology and Medicine. 2021; 136:104697. [DOI:10.1016/j.compbiomed.2021.104697] [PMID]
- Sadeghi D, Shoeibi A, Ghassemi N, Moridian P, Khadem A, Alizadehsani R, et al. An overview on artificial intelligence techniques for diagnosis of schizophrenia based on magnetic resonance imaging modalities: Methods, challenges, and future works. arXiv preprint arXiv:2103.03081. 2021. https://arxiv.org/abs/2103.03081
- Alizadehsani R, Sharifrazi D, Izadi NH, Joloudari JH, Shoeibi A, Gorriz JM, et al. Uncertainty-aware semi-supervised method using large unlabeled and limited labeled COVID-19 data. ACM Transactions on Multimedia Computing, Communications, and Applications. 2021; 17(3s):1-24. [DOI:10.1145/3462635]
- Yang J, Yao S, Wang J. Deep fusion feature learning network for MI-EEG classification. IEEE Access. 2018; 6:79050-9. [DOI:10.1109/ACCESS.2018.2877452]
- Amin SU, Alsulaiman M, Muhammad G, Mekhtiche MA, Hossain MS. Deep Learning for EEG motor imagery classification based on multi-layer CNNs feature fusion. Future Generation Computer Systems. 2019; 101:542-54. [DOI:10.1016/j.future.2019.06.027]
- Hu D, Cao J, Lai X, Wang Y, Wang S, Ding Y. Epileptic state classification by fusing hand-crafted and deep learning EEG features. IEEE Transactions on Circuits and Systems II: Express Briefs. 2020; 68(4):1542-6. [DOI:10.1109/TCSII.2020.3031399]
Type of Study: Original |
Subject:
Diseases
Received: 2021/09/18 | Accepted: 2021/12/4 | Published: 2022/01/1
Received: 2021/09/18 | Accepted: 2021/12/4 | Published: 2022/01/1
| Rights and permissions | |
 |
This work is licensed under a Creative Commons Attribution-NonCommercial 4.0 International License. |