

Volume 29, Issue 2 (Spring 2023)
Intern Med Today 2023, 29(2): 122-130 |
Back to browse issues page


![]()
![]()
![]()
Download citation:
BibTeX | RIS | EndNote | Medlars | ProCite | Reference Manager | RefWorks
Send citation to:


BibTeX | RIS | EndNote | Medlars | ProCite | Reference Manager | RefWorks
Send citation to:
Golikhatir I, Sazgar M, Jahanian F, Niksalehi S, Aminiahidashti H. Renal Resistive Index in Patients with Septic Shock: Changes in the Renal Resistive Index in the Assessment of Response to Treatment during Resuscitation of Patients with Septic Shock; a Prospective Observational Study. Intern Med Today 2023; 29 (2) :122-130
URL: http://imtj.gmu.ac.ir/article-1-4022-en.html
URL: http://imtj.gmu.ac.ir/article-1-4022-en.html
Iraj Golikhatir1 

 , Mohammad Sazgar1 , Fatemeh Jahanian1 , Soroush Niksalehi1 , Hamed Aminiahidashti *2
, Mohammad Sazgar1 , Fatemeh Jahanian1 , Soroush Niksalehi1 , Hamed Aminiahidashti *2
1- Department of Emergency Medicine, Mazandaran University of Medical Sciences, Sari, Iran.
2- Department of Emergency Medicine, Mazandaran University of Medical Sciences, Sari, Iran. ,hamedaminiahidashti@yahoo.com
2- Department of Emergency Medicine, Mazandaran University of Medical Sciences, Sari, Iran. ,
Full-Text [PDF 766 kb]
(789 Downloads)
| Abstract (HTML) (2769 Views)
Sepsis which is a life-threatening disorder involving body organs is caused by the dysregulation of the host response to infection leading to hypo perfusion in organs and tissue. It is considered a septic shock if vasoactive agents are required due to low blood pressure after appropriate fluid management [1, 2]. Septic shock is associated with a high mortality rate if proper therapeutic interventions are not provided [3]. Macro circulatory (i.e., central venous pressure (CVP) and mean arterial pressure (MAP), and microcirculatory (i.e., urine output (UO) and lactate level) parameters should be assessed during the treatment of patients with septic shock, the goals set in the resuscitation of such patients [3]. The kidney which is one of the major organs affected by septic shock reduces UO and causes renal damage by reducing renal perfusion and inflammatory changes [4, 5]. Renal resistive index (RRI) is one of the indices illustrating the hemodynamics of the kidneys; changes in hemodynamics and intravascular volume affect RRI [6]. A negative relationship was detected between RRI and MAP in patients with acute kidney injury (AKI); nonetheless, the same relationship was not observed between RRI and cardiac output in patients with other critical illnesses [7]. However, some studies demonstrated that RRI decreased significantly in patients with septic shock whose MAP values increased from 65 to 75 mmHg following norepinephrine administration, and RRI is suggested as the most rapid indicator of optimum MAP for renal perfusion and retention of UO. Therefore, optimal MAP, which can be determined based on RRI, is a systemic parameter, suggesting tissue perfusion in patients with septic shock [8]. It was hypothesized that the RRI value is an indicator of tissue perfusion in assessing the improvement of patients with septic shock. In light of the aforementioned issues, the present study aimed to assess the RRI changes along with other therapeutic parameters within six hours of receiving the standard treatment of septic shock. The assessment of this non-invasive index in patients with septic shock can be of great help in the management of their treatment.
The present single-center, prospective, observational study was performed in the Emergency Department (ED) of Emam Khomeini Educational Hospital in Sari, Iran, from July 2018 to September 2019. This hospital is a tertiary care center in Sari with referrals from all hospitals in Northern Iran. The ED of this center is equipped with five beds in the intensive care unit (ICU) called ED-ICU [9]. The critically ill patients requiring intensive care, including those that should undergo mechanical ventilation, and need invasive hemodynamic monitoring or critical observation, are admitted to this unit. The present single-center, prospective, observational study was performed on all patients with septic shock admitted to the ED-ICU during the study period. Septic shock was diagnosed in the present study based on the Third International Consensus Definitions for Sepsis and Septic Shock (Sepsis-3) [1]. All the patients aged above 18 years diagnosed with septic shock and referring to ED were included in the study. Patients who were excluded from the study included those with known chronic kidney disease, those undergoing abdominal radiotherapy or dialysis, patients with trauma, those undergoing cardiopulmonary resuscitation, those who died within the six hours of follow-up, and patients without a clear ultrasound view. In the present study, patient’s information, including age, gender, past medical disease, physiological scoring, vital signs (Vital signs were measured by sphygmomanometer, heart rate monitoring, and pulse oximeter), and paraclinical findings, were collected prospectively. Vital signs, RRI, UO, and central venous pressure, were measured, and the interpretation of arterial blood gases was performed during the study period. Finally, the mortality rate of the patients was assessed after 30 days.
All the subjects underwent standard treatment according to the Guidelines of the American College of Critical Care Medicine [10], including early goal-directed resuscitation in the first six hours of septic shock. A urinary catheter and an internal jugular or subclavian venous catheter were inserted for the subjects. All patients with CVP≥ 8 and without any changes in hemodynamic status after receiving one liter of crystalloid fluid were considered non-volume-responsive. Those who were non-volume-responsive were given a maintenance crystalloid fluid of one liter in 8 hours and a minimum effective dose of a vasopressor (3 microgram/minute) to maintain MAP at 65 mmHg [11]. Norepinephrine was the only vasopressor used in the current study. All patients were followed up for six hours, during which their body temperature, heart rate, blood pressure, respiration rate, UO, central venous pressure, and blood gas were measured on arrival, as well as 30 and 120 minutes, and six hours after the treatment onset. Age and gender were recorded; moreover, their simplified acute physiology score (SAPS) II and acute physiology and chronic health evaluation (APACHE) II were determined. The RRI was determined by Doppler ultrasound (Sonosite EDGE) of renal interlobular veins performed by an emergency physician who was qualified in using a 2-5-MHz curved probe (Figure 1). The RRI was measured at baseline (RRI0), as well as 30 (RRI30) and 120 (RRI120) minutes and six hours (RRI6h) after the treatment onset.
The right kidney is observed on the monitor if the 2-5MHz curved prop is placed on the right side midaxillary line, as the transducer dot facing upwards, and the interlobular artery of the kidney a13re then identified using the color option. Using continuous-wave Doppler, the interlobular artery is detected in the same place. The gain adjustment is also used for greater clarity of images and waves. An image with three clear continuous waves is considered ideal, and the frozen image and RI are calculated as peak systolic velocity-end diastolic velocity/peak systolic velocity. All three continuous waves on the monitor are used to calculate RI and, the mean value is considered the overall RI for all patients [12]. RRI changes were assessed and evaluated within six hours of the treatment process.
.jpg)

![]()
Figure 1. Doppler ultrasound of interlobular veins was performed on the right kidney. Date were expressed in five consecutive waves with IR=0.67
Based on the Kolmogorov-Smirnov test results, the hypothesis of the normality of continuous variables was confirmed (P=0.05). Therefore, independent samples t-test was used to compare continuous variables and the Chi-square test was utilized for qualitative variables. Continuous variables were expressed as mean±standard deviation and qualitative variables were presented as median (interquartile range). The repeated measures ANOVA was employed to compare RRI levels at different time points between the two groups of patients
surviving more than 30 days (the survival group) and those dying before 30 days (the non-survival group). To compare RRI values at different time points, the Friedman nonparametric test was employed. the logistic regression model was used to investigate its effect during the study. Data analysis was performed using SPSS (version 13.0), STAT, and R software packages.
.jpg)
![]()
Figure 2. Patient Flowchart
Table 1. Comparison of basal characteristics of survived and non-survived patients in study
.jpg)
![]()
Figure 3. Changes in RPI at different time points from treatment onset. Boxplot diagram of PRI difference between pantients achieving (MAP≥65 and CVP ≥8 mmHg) and not achieving treatment goals.
![]()
Figure 4. PRI changes during the study in groups achieving (MAP ≥65 and CVP≥8 mmHg) and not achieving the treatment goal. Table 2. Patients’ RRI during the study
Full-Text: (606 Views)
|
Sepsis which is a life-threatening disorder involving body organs is caused by the dysregulation of the host response to infection leading to hypo perfusion in organs and tissue. It is considered a septic shock if vasoactive agents are required due to low blood pressure after appropriate fluid management [1, 2]. Septic shock is associated with a high mortality rate if proper therapeutic interventions are not provided [3]. Macro circulatory (i.e., central venous pressure (CVP) and mean arterial pressure (MAP), and microcirculatory (i.e., urine output (UO) and lactate level) parameters should be assessed during the treatment of patients with septic shock, the goals set in the resuscitation of such patients [3]. The kidney which is one of the major organs affected by septic shock reduces UO and causes renal damage by reducing renal perfusion and inflammatory changes [4, 5]. Renal resistive index (RRI) is one of the indices illustrating the hemodynamics of the kidneys; changes in hemodynamics and intravascular volume affect RRI [6]. A negative relationship was detected between RRI and MAP in patients with acute kidney injury (AKI); nonetheless, the same relationship was not observed between RRI and cardiac output in patients with other critical illnesses [7]. However, some studies demonstrated that RRI decreased significantly in patients with septic shock whose MAP values increased from 65 to 75 mmHg following norepinephrine administration, and RRI is suggested as the most rapid indicator of optimum MAP for renal perfusion and retention of UO. Therefore, optimal MAP, which can be determined based on RRI, is a systemic parameter, suggesting tissue perfusion in patients with septic shock [8]. It was hypothesized that the RRI value is an indicator of tissue perfusion in assessing the improvement of patients with septic shock. In light of the aforementioned issues, the present study aimed to assess the RRI changes along with other therapeutic parameters within six hours of receiving the standard treatment of septic shock. The assessment of this non-invasive index in patients with septic shock can be of great help in the management of their treatment.
Materials and Methods
The present single-center, prospective, observational study was performed in the Emergency Department (ED) of Emam Khomeini Educational Hospital in Sari, Iran, from July 2018 to September 2019. This hospital is a tertiary care center in Sari with referrals from all hospitals in Northern Iran. The ED of this center is equipped with five beds in the intensive care unit (ICU) called ED-ICU [9]. The critically ill patients requiring intensive care, including those that should undergo mechanical ventilation, and need invasive hemodynamic monitoring or critical observation, are admitted to this unit. The present single-center, prospective, observational study was performed on all patients with septic shock admitted to the ED-ICU during the study period. Septic shock was diagnosed in the present study based on the Third International Consensus Definitions for Sepsis and Septic Shock (Sepsis-3) [1]. All the patients aged above 18 years diagnosed with septic shock and referring to ED were included in the study. Patients who were excluded from the study included those with known chronic kidney disease, those undergoing abdominal radiotherapy or dialysis, patients with trauma, those undergoing cardiopulmonary resuscitation, those who died within the six hours of follow-up, and patients without a clear ultrasound view. In the present study, patient’s information, including age, gender, past medical disease, physiological scoring, vital signs (Vital signs were measured by sphygmomanometer, heart rate monitoring, and pulse oximeter), and paraclinical findings, were collected prospectively. Vital signs, RRI, UO, and central venous pressure, were measured, and the interpretation of arterial blood gases was performed during the study period. Finally, the mortality rate of the patients was assessed after 30 days.
All the subjects underwent standard treatment according to the Guidelines of the American College of Critical Care Medicine [10], including early goal-directed resuscitation in the first six hours of septic shock. A urinary catheter and an internal jugular or subclavian venous catheter were inserted for the subjects. All patients with CVP≥ 8 and without any changes in hemodynamic status after receiving one liter of crystalloid fluid were considered non-volume-responsive. Those who were non-volume-responsive were given a maintenance crystalloid fluid of one liter in 8 hours and a minimum effective dose of a vasopressor (3 microgram/minute) to maintain MAP at 65 mmHg [11]. Norepinephrine was the only vasopressor used in the current study. All patients were followed up for six hours, during which their body temperature, heart rate, blood pressure, respiration rate, UO, central venous pressure, and blood gas were measured on arrival, as well as 30 and 120 minutes, and six hours after the treatment onset. Age and gender were recorded; moreover, their simplified acute physiology score (SAPS) II and acute physiology and chronic health evaluation (APACHE) II were determined. The RRI was determined by Doppler ultrasound (Sonosite EDGE) of renal interlobular veins performed by an emergency physician who was qualified in using a 2-5-MHz curved probe (Figure 1). The RRI was measured at baseline (RRI0), as well as 30 (RRI30) and 120 (RRI120) minutes and six hours (RRI6h) after the treatment onset.
The right kidney is observed on the monitor if the 2-5MHz curved prop is placed on the right side midaxillary line, as the transducer dot facing upwards, and the interlobular artery of the kidney a13re then identified using the color option. Using continuous-wave Doppler, the interlobular artery is detected in the same place. The gain adjustment is also used for greater clarity of images and waves. An image with three clear continuous waves is considered ideal, and the frozen image and RI are calculated as peak systolic velocity-end diastolic velocity/peak systolic velocity. All three continuous waves on the monitor are used to calculate RI and, the mean value is considered the overall RI for all patients [12]. RRI changes were assessed and evaluated within six hours of the treatment process.
Figure 1. Doppler ultrasound of interlobular veins was performed on the right kidney. Date were expressed in five consecutive waves with IR=0.67
Based on the Kolmogorov-Smirnov test results, the hypothesis of the normality of continuous variables was confirmed (P=0.05). Therefore, independent samples t-test was used to compare continuous variables and the Chi-square test was utilized for qualitative variables. Continuous variables were expressed as mean±standard deviation and qualitative variables were presented as median (interquartile range). The repeated measures ANOVA was employed to compare RRI levels at different time points between the two groups of patients
surviving more than 30 days (the survival group) and those dying before 30 days (the non-survival group). To compare RRI values at different time points, the Friedman nonparametric test was employed. the logistic regression model was used to investigate its effect during the study. Data analysis was performed using SPSS (version 13.0), STAT, and R software packages.
Results
Out of 183 patients with septic shock referring to ED during the study period, 109 (59.56%) cases completed the study, and their data were analyzed (Figure 2).
The mean age of patients was 67.62±14.67 years, and 65 (59.1%) subjects were males. Moreover, 41 (37.3%) cases died, and the mean scores of the subjects in APACHE II and SAPS were 23.46±21.76 and 50.54±21.76, respectively, demonstrating a significant difference between the non-survival and survival groups. In addition, 34 (30.9%), 48 (43.6%), 13 (11.8%), and 14 (12.7%) subjects had urinary tract infections, respiratory infections, abdominal infections, and other causes of septic shock. The prevalence of urinary tract infections was significantly higher in those who died. Moreover, 54 (49.1%), 26 (23.6), 44 (40%), and 33 (30%) subjects had diabetes (DM), subjects chronic obstructive disease (COPD), cancer, and hypertension (HTN). In addition, 28 (25.5%) cases were smoker and 6 (5.5%) subjects used corticosteroids. The prevalence of underlying diseases, such as diabetes, cancer, and hypertension, were significantly higher in the non-survival group. In total, 46 (42.2%) patients underwent mechanical ventilation, the majority belonging to the non-survival group and 43 (39.45%) subjects underwent packed-cell infusion during the study period. The mean MAP of patients on arrival and six hours after the treatment onset was 72.82±8.49 mmHg and 93.51±5.64 mmHg, respectively, with a significant increase over time (P=<0.001). Systolic blood pressure increased from 80.82±12.63 mmHg on arrival to 107.75±17.62 mmHg during the treatment (P=0.01), and their heart rate had no significant changes over time (115.18±11.3 beat/minute on arrival versus 95.21±8.62 beat/minute after six hours of treatment onset (P=0.63). RRI increased from 0.71±0.03 on arrival to 0.70±0.1 after six hours of treatment onset (P=0.05); RRI value was significantly higher in the non-survival group until the 30 minutes of treatment onset, compared to survivals (Table 1).
The mean age of patients was 67.62±14.67 years, and 65 (59.1%) subjects were males. Moreover, 41 (37.3%) cases died, and the mean scores of the subjects in APACHE II and SAPS were 23.46±21.76 and 50.54±21.76, respectively, demonstrating a significant difference between the non-survival and survival groups. In addition, 34 (30.9%), 48 (43.6%), 13 (11.8%), and 14 (12.7%) subjects had urinary tract infections, respiratory infections, abdominal infections, and other causes of septic shock. The prevalence of urinary tract infections was significantly higher in those who died. Moreover, 54 (49.1%), 26 (23.6), 44 (40%), and 33 (30%) subjects had diabetes (DM), subjects chronic obstructive disease (COPD), cancer, and hypertension (HTN). In addition, 28 (25.5%) cases were smoker and 6 (5.5%) subjects used corticosteroids. The prevalence of underlying diseases, such as diabetes, cancer, and hypertension, were significantly higher in the non-survival group. In total, 46 (42.2%) patients underwent mechanical ventilation, the majority belonging to the non-survival group and 43 (39.45%) subjects underwent packed-cell infusion during the study period. The mean MAP of patients on arrival and six hours after the treatment onset was 72.82±8.49 mmHg and 93.51±5.64 mmHg, respectively, with a significant increase over time (P=<0.001). Systolic blood pressure increased from 80.82±12.63 mmHg on arrival to 107.75±17.62 mmHg during the treatment (P=0.01), and their heart rate had no significant changes over time (115.18±11.3 beat/minute on arrival versus 95.21±8.62 beat/minute after six hours of treatment onset (P=0.63). RRI increased from 0.71±0.03 on arrival to 0.70±0.1 after six hours of treatment onset (P=0.05); RRI value was significantly higher in the non-survival group until the 30 minutes of treatment onset, compared to survivals (Table 1).
Figure 2. Patient Flowchart
Table 1. Comparison of basal characteristics of survived and non-survived patients in study
| P-value | Total | Variable | ||
| Non-survived (n=41) | Survived(n=68) | |||
| 1.000 | 24 (22) | 41 (37.6) | Male | Gender |
| 17 (15.6) | 27 (24.8) | Female | ||
| 0.225 | 69.83 (14.704) | 66.29 (14.6) | Age (yr) Mean (SD) |
|
| 0.042 | 55.97 (17.70) | 47.26 (23.40) | SAPS II †, mean (SD) |
|
| 0.013 | 26.68 (11.16) | 21.53 (9.79) | APACHE II ‡, mean (SD) |
|
| 0.026 | 18 (43.9) | 16 (23.5) | Urinary, n (%) | Origin of sepsis |
| 0.092 | 14 (34.1) | 34 (50.7) | Respiratory, n (%) | |
| 0.946 | 5 (12.2) | 8 (11.8) | Abdominal, n (%) | |
| 0.454 | 4 (9.8) | 10 (14.7) | Others, n (%) | |
| 0.024 | 26 (63.4) | 28 (41.2) | Diabetes, n (%) | Past medical history |
| 0.135 | 13 (31.7) | 13 (19.1) | Chronic obstructive disease, n (%) | |
| <0.001 | 33 (80.5) | 11 (16.2) | Cancer, n (%) | |
| 0.117 | 14 (34.1) | 14 (20.6) | Tobacco use, n (%) | |
| 0.048 | 17 (41.5) | 16 (23.5) | Hypertension, n (%) | |
| 0.131 | 4 (9.8) | 2 (2.9) | Corticosteroids use, n (%) | |
| <0.001 | 30 (27.5( | 16 (14.7( | Patients requiring mechanical ventilation | |
| 0.163 | 20 (18.3) | 23 (21.1) | Patients undergoing blood transfusion | |
| <0.001 | 87.445 (12.436) | 97.088 (8.011) | mean SBP, mmHg | |
| 0.001 | 75.88 (15.576) | 83.79 (9.412) | SBP on arrival, mmHg | |
| 0.008 | 84.15 (10.66) | 89.56 (9.763) | SBP at 30 min, mmHg | |
| <0.001 | 91.34 (18.132) | 101.62 (8.913) | SBP at 120 min, mmHg | |
| <0.001 | 98.41(24.301) | 113.38 (7.891) | SBP after 6 h, mmHg | |
| <0.001 | 77.896 (10.995) | 85.433 (6.663) | Mean MAP | |
| 0.001 | 69.512 (9.375) | 75.191(7.827) | MAP on arrival | |
| 0.010 | 74.683 (9.078) | 79.176 (8.343) | MAP at 30 min | |
| <0.001 | 80.927(15.685) | 89.353 (7.521) | MAP at 120 min | |
| 0.002 | 86.463 (21.479) | 98.015 (6.888) | MAP after 6 h | |
| 0.405 | 102.006 (12.391) | 100. 180 (8.244) | Mean PR | |
| 0.379 | 116.41(11.28) | 114.44 (11.327) | PR on arrival | |
| 0.729 | 105.44 (17.641) | 104.56 (8.773) | PR at 30 min | |
| 0.306 | 97.78 (18.85) | 94.6 (7.249) | PR at 120 min | |
| 0.736 | 88.39 (22.065) | 87.12 (12.311) | PR after 6 h | |
| 0.006 | 0.718 (0.063) | 0.693 (0.025) | Mean RRI | |
| <0.001 | 0.733 (0.024) | 0.699 (0.020) | RRI on arrival | |
| <0.001 | 0.732 (0.023) | 0.699 (0.021) | RRI at 30 min | |
| 0.141 | 0.712 (0.116) | 0.683 (0.086) | RRI at 120 min | |
| 0.936 | 0.694 (0.161) | 0.692 (0.024) | RRI after 6 h | |
|
||||
† SAPS: Simplified Acute Physiology Score
‡ APACHE II: Acute Physiology and Chronic Health Evaluation II; IQR: interquartile range; 3.2. Outcome data
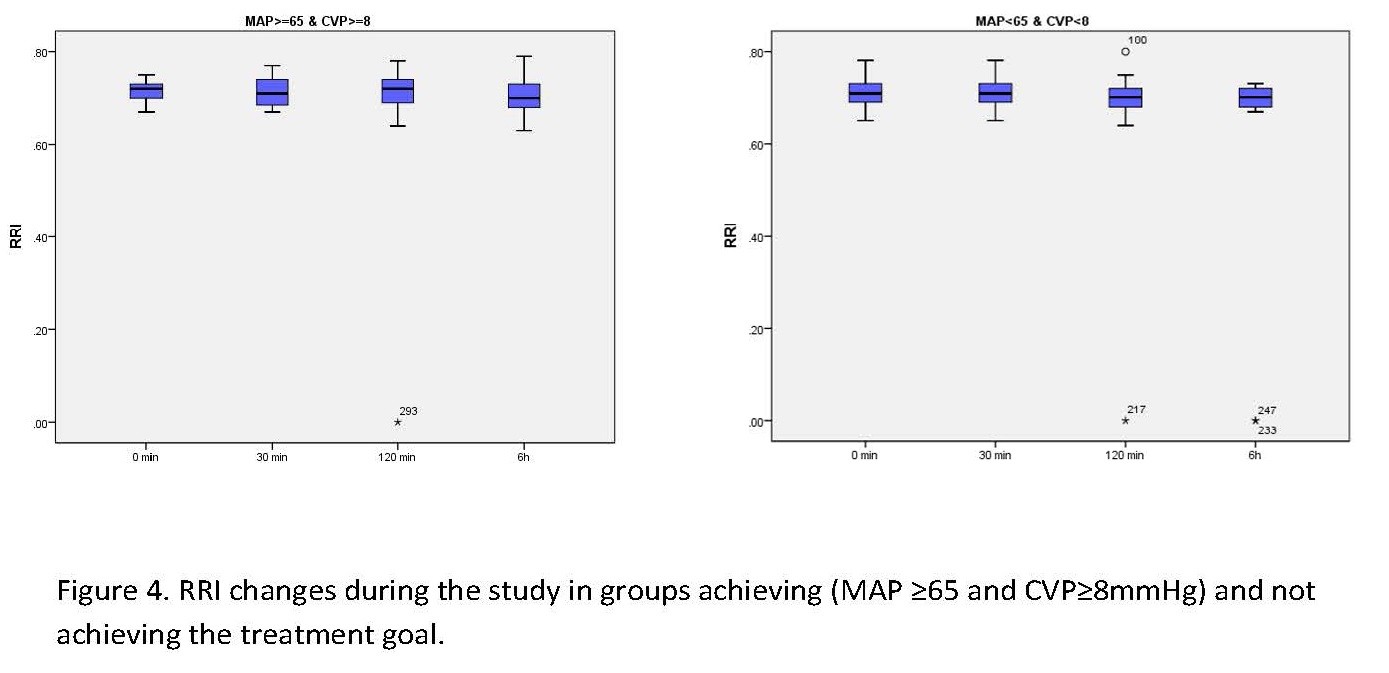
Treatment was based on the early goal-directed resuscitation [13], and the treatment goal was set to MAP ≥65mmHg and CVP ≥8mmHg; RRI was determined accordingly at different time points (Figure 3).
There was no significant difference in RRI values between the two groups on arrival and 30 minutes and six hours after the treatment onset. For a more detailed evaluation, the Mann-Whitney nonparametric test was used, in which the P-value of 0.413 indicated the same mean RRI on arrival, as well as P=0.172 for RRI 30 and P=0.405 for RRI 6h. Nonetheless, in the second hour of treatment, a significant difference was found between RRI120 values (P=0.05). RRI values were generally compared in Figure 4.
To compare RRI levels at different time points, the Friedman nonparametric test (given that the normality of the data was rejected) was used. The mean RRI rank at different time points is presented in Table 2.
The mean rating value decreased over time from RRI on arrival to RRI after six hours. There was a significant difference among RRI levels at four time points (0, 30, and 120 minutes, as well as six hours). The Wilcoxon post hoc test was utilized to examine RRI level variability across time points (Table 3).
Figure 3. Changes in RPI at different time points from treatment onset. Boxplot diagram of PRI difference between pantients achieving (MAP≥65 and CVP ≥8 mmHg) and not achieving treatment goals.
Figure 4. PRI changes during the study in groups achieving (MAP ≥65 and CVP≥8 mmHg) and not achieving the treatment goal. Table 2. Patients’ RRI during the study
| P-value | Mean Rank | Mean (SD) | |
| <0.001 | 2.88 | 0.7124(0.27) | RRI on arrival |
| 2.86 | 0.7119(0.27) | RRI at 30 min | |
| 2.30 | 0.6948(0.1) | RRI at 120 min | |
| 1.97 | 0.6931(0.1) | RRI after 6 h | |
|
|||
a. Friedman test t
Table 3. RRI Changes at Different Time Points
Table 3. RRI Changes at Different Time Points
| RRI6h-RRI120 | RRI6h-RRI30 | RR120-RRI30 | RR6h-RRI0 | RRI120-RRI0 | RRI30-RRI0 | |
| 0.013 | <0.001 | <0.001 | <0.001 | <0.001 | .305 | P-value |
|
||||||
a. Wilcoxon signed ranks test
To calculate the significance level, the Bonferroni correction was used as .png) . Therefore, in Table 3, differences between the groups with a P<0.008 were considered significant. Therefore, there was a significant difference in RRI levels between the time points of (0 and 120), (0 and six hours), (30 and 120 minutes), and (30 minutes and six hours). The RRI level decreased at 120 minutes compared to RRI on arrival, at six hours compared to zero minutes, at 120 minutes compared to 30 minutes, and at six hours compared to 30 minutes. Using logistic regression, the Omnibus tests of model coefficients illustrated that RRI had no significant effect on achieving the treatment goal of MAP ≥65 mmHg and CVP ≥8 mmHg. The P-values were 0.54 on arrival, 0.26 at 30 minutes, 0.40 at 120 minutes, and 0.54 after six hours.
. Therefore, in Table 3, differences between the groups with a P<0.008 were considered significant. Therefore, there was a significant difference in RRI levels between the time points of (0 and 120), (0 and six hours), (30 and 120 minutes), and (30 minutes and six hours). The RRI level decreased at 120 minutes compared to RRI on arrival, at six hours compared to zero minutes, at 120 minutes compared to 30 minutes, and at six hours compared to 30 minutes. Using logistic regression, the Omnibus tests of model coefficients illustrated that RRI had no significant effect on achieving the treatment goal of MAP ≥65 mmHg and CVP ≥8 mmHg. The P-values were 0.54 on arrival, 0.26 at 30 minutes, 0.40 at 120 minutes, and 0.54 after six hours.
Discussion
In the study, the RRI value decreased significantly only 120 minutes after the treatment onset in the group achieving the treatment goal, compared to those not achieving; however, on arrival, as well as 30 minutes and six hours after the treatment onset, the RRI value had no significant changes; nonetheless, in general, RRI value decreased during the study period. Studies pointed out that with increasing blood pressure from 65 to 85 mmHg, the RRI value significantly decreased [8], pointing to the negative (inverse) relationship of MAP value with RRI at 30 and 120 minutes, as well as a positive (direct) relationship after six hours. Using Pearson correlation, the correlation between MAP and RRI was confirmed (). The MAP increase and RRI decrease during the study indicated an inverse relationship between the two variables and similar results were also observed in a study demonstrating that the increase in pressure was accompanied by a decrease in the kidney [14]. Some studies also highlighted a weak and inverse relationship between the two variables in patients with septic shock without acute kidney injury, and RRI alone cannot indicate hemodynamic changes in such patients to reflect optimal MAP [15, 16]. In the study by Deruddre S and et al., RRI was used as a marker of renal perfusion in the management of patients with septic shock [8]. Given that in the present study, the RRI value decreased during the study, it can be used as a volume and hemodynamic assessment index. In some studies, the hemodynamic changes caused by fluid challenges did not lead to changes in RRI [17]. The presence of underlying diseases, such as diabetes and hypertension, was significantly higher in those who died; in some studies, since such diseases affect vascular compliance, they eventually led to an increase in RRI [18]. Critically ill patients with septic shock admitted to ICU had a higher RRI than their counterparts without septic shock (19), and in the present study, the subjects who died had a higher RRI than those who survived. Increased RRI was strongly associated with multiple organ failure [20,21]. In the present study, the RRI value was significantly higher in those who died or were critically ill based on SAPS II and APACHE II criteria. Some studies revealed that higher RRI increased the need for mechanical ventilation in patients with sepsis [22]. A high renal resistance index is a sign of failure to reach the treatment goals and deterioration of the patient's condition. In some studies, RRI was the best predictor of acute kidney injury in septic shock [23]. Nevertheless, in the present research, the mortality rate was higher in those undergoing mechanical ventilation. Based on the results, RRI was 0.73±0.06 in those undergoing mechanical ventilation and 0.70±0.03 in the subjects not undergoing invasive airway management; the difference between the groups was statistically significant (). The use of both RRI and CVP had a higher predictive value than using one alone to diagnose acute renal failure caused by sepsis [24]. However, in those with a CVP of <8 mmHg, the mean scores of disease severity based on SAPS II and APACHE II scores were 51.60±22.52 and 23.47±11.49; nonetheless, they were 49.01±21.18 in SAPS II and 23.21±10.14 in APACHE II in those with a CVP of ≥8 mmHg, illustrating a statistically significant difference. However, factors, such as age, are directly correlated with RRI (), and in some studies, aging was associated with vascular changes, and decreased renal vascular compliance affected RRI value [25]. Although some conditions, such as DM and HTN, are known as diseases causing AKI [26], these conditions had no correlations with RRI value in the present study (). Among the notable limitations of this study, we can refer to the lack of patients’ follow-up after six hours (). Moreover, the small sample size and the lack of enrolment of those who died during the study were other limitations of the study. Nearly double the number of patients were intubated in the non-survivor group. It is conceivable that PPV would affect RRI. A multicenter study with a larger sample size and prolonged follow-up course to determine whether RRI can be used as a marker of volume assessment in patients with septic shock is recommended.
. Therefore, in Table 3, differences between the groups with a P<0.008 were considered significant. Therefore, there was a significant difference in RRI levels between the time points of (0 and 120), (0 and six hours), (30 and 120 minutes), and (30 minutes and six hours). The RRI level decreased at 120 minutes compared to RRI on arrival, at six hours compared to zero minutes, at 120 minutes compared to 30 minutes, and at six hours compared to 30 minutes. Using logistic regression, the Omnibus tests of model coefficients illustrated that RRI had no significant effect on achieving the treatment goal of MAP ≥65 mmHg and CVP ≥8 mmHg. The P-values were 0.54 on arrival, 0.26 at 30 minutes, 0.40 at 120 minutes, and 0.54 after six hours.Discussion
Conclusion
The RRI was different between survivors and nonsurvivors in this study and patients with higher MAP had lower RRI values on arrival and their MAP increased and RRI decreased during the treatment. In addition, RRI reduction occurred at the beginning of resuscitation with fluids and norepinephrine infusion. Therefore, RRI changes can be used during the treatment of patients with septic shock and RRI is feasible to track in an EDICU and may play a role in the monitoring for treatment efficacy; nonetheless, more studies are required.
Ethical Considerations
Compliance with ethical guidelines
The present study protocol was approved by the Ethics Committee of Imam Khomeini Medical Center affiliated with Mazandaran University of Medical Sciences (ethical code: IR.MAZUMZ.IMAMHOSPITAL.REC.1397.084). Informed consent was obtained from the legal representatives of all eligible patients.
Funding
This study was extracted from a thesis project financially supported by a grant (No: 2937) from Mazandaran University of Medical Sciences.
Authors' contributions
HA contributed to the project development and study design. SN and FJ contributed data collection and interpretation of the data. HA, MS, and FJ contributed to data analysis. HA and IG developed the manuscript. HA critically edited and revised the manuscript. All authors read and approved the final manuscript.
Conflicts of interest
Not applicable.
Acknowledgments
The authors thank the ED-ICU nurses for their assistance in carrying out the medication instructions for the patients studied.
References
- Singer M, Deutschman CS, Seymour CW, Shankar-Hari M, Annane D, Bauer M, et al. The third international consensus definitions for sepsis and septic shock (sepsis-3). JAMA. 2016 23;315(8):801-10. [DOI: 10.1001/jama.2016.0287].
- Trzeciak S, McCoy JV, Phillip Dellinger R, Arnold RC, Rizzuto M, Abate NL, et al. Early increases in microcirculatory perfusion during protocol-directed resuscitation are associated with reduced multi-organ failure at 24 h in patients with sepsis. Intensive Care Med. 2008;34(12):2210-7. [DOI: 10.1007/s00134-008-1193-6] [PMID] [PMCID].
- Rhodes A, Evans LE, Alhazzani W, Levy MM, Antonelli M, Ferrer R, et al. Surviving sepsis campaign: International guidelines for management of sepsis and septic shock: 2016. Intensive Care Med. 2017;43(3):304-77.[DOI: 10.1007/s00134-017-4683-6] [ PMID]
- Wan L, Bagshaw SM, Langenberg C, Saotome T, May C, Bellomo R. Pathophysiology of septic acute kidney injury: what do we really know? Crit Care Med. 2008;36(4 Suppl):S198-203. [DOI: 10.1097/CCM.0b013e318168ccd5] [PMID].
- Schrier RW, Wang W. Acute renal failure and sepsis. N Engl J Med. 2004;351(2):159-69. [DOI: 10.1056/NEJMra032401] [PMID].
Sommese A, Lima A, Van Bommel J, Bakker J. Effects of central hypovolemia induced by tilt table on the Doppler- based renal resistive index in healthy volunteers. Crit Care. 2014;18(Suppl 1):P147.[ DOI: 10.1186/cc13337]
- de Oliveira RAG, Taniguchi LU, Park M, Mendes PV. Influence of mean arterial pressure and cardiac output on renal vascular tone reflected by the renal Doppler resistive index in critically ill patients. Crit Care. 2015;19(S2). [DOI: 10.1186/cc14708] [PMCID].
- Deruddre S, Cheisson G, Mazoit JX, Vicaut E, Benhamou D, Duranteau J. Renal arterial resistance in septic shock: effects of increasing mean arterial pressure with norepinephrine on the renal resistive index assessed with Doppler ultrasonography. Intensive Care Med. 2007;33(9):1557-62.[DOI: 10.1007/s00134-007-0665-4] [PMID].
- Aminiahidashti H. The establishment of the emergency department intensive care unit. Iranian Journal of Emergency Medicine. 2016;3(4):122-24.[DOI: 10.22037/ijem.v3i4.13759].
- Dellinger RP, Carlet JM, Masur H, Gerlach H, Calandra T, Cohen J, et al. Surviving sepsis campaign guidelines for management of severe sepsis and septic shock. Crit Care Med. 2004;32(3):858-73.[DOI: 10.1097/01.ccm.0000117317.18092.e4] [ PMID]
- Michard F, Boussat S, Chemla D, Anguel N, Mercat A, Lecarpentier Y, et al. Relation between respiratory changes in arterial pulse pressure and fluid responsiveness in septic patients with acute circulatory failure. Am J Respir Crit Care Med. 2000;162(1):134-8. [DOI: 10.1164/ajrccm.162.1.9903035] [PMID].
- Tublin ME, Bude RO, Platt JF. Review. The resistive index in renal Doppler sonography: where do we stand? AJR Am J Roentgenol. 2003;180(4):885-92. [DOI 10.2214/ajr.180.4.1800885][PMID].
- Dellinger RP, Levy MM, Rhodes A, Annane D, Gerlach H, Opal SM, et al. Surviving Sepsis Campaign: international guidelines for management of severe sepsis and septic shock, 2012. Intensive Care Med. 2013;39(2):165-228.[DIO: 10.1007/s00134-012-2769-8] [PMID] [PMCID].
- Fotopoulou G, Poularas I, Kokkoris S, Charitidou E, Boletis I, Brountzos E, Benetos A, Zakynthinos S, Routsi C. Renal resistive index on intensive care unit admission correlates with tissue hypoperfusion indices and predicts clinical outcome. Shock. 2022;57(4):501-7. [ DOI: 10.1097/SHK.0000000000001896] [PMID].
- Dewitte A, Coquin J, Meyssignac B, Joannes-Boyau O, Fleureau C, Roze H, et al. Doppler resistive index to reflect regulation of renal vascular tone during sepsis and acute kidney injury. Crit Care. 2012;16(5):R165.[ DOI: 10.1186/cc11517] [PMCID] [PMID].
- Schnell D, Camous L, Guyomarc'h S, Duranteau J, Canet E, Gery P, et al. Renal perfusion assessment by renal Doppler during fluid challenge in sepsis. Crit Care Med. 2013;41(5):1214-20.[ DOI: 10.1097/CCM.0b013e31827c0a36] [PMID].
- Lahmer T, Rasch S, Schnappauf C, Schmid RM, Huber W. Influence of volume administration on Doppler-based renal resistive index, renal hemodynamics and renal function in medical intensive care unit patients with septic-induced acute kidney injury: a pilot study. Int Urol Nephrol. 2016;48(8):1327-34.[DOI: 10.1007/s11255-016-1312-1] [PMID].
- Hashimoto J, Ito S. Central pulse pressure and aortic stiffness determine renal hemodynamics: pathophysiological implication for microalbuminuria in hypertension. Hypertension. 2011;58(5):839-46. [DOI: 10.1161/HYPERTENSIONAHA.111.177469] [PMID].
- Rozemeijer S, Haitsma Mulier JLG, Rottgering JG, Elbers PWG, Spoelstra-de Man AME, Tuinman PR, et al. Renal resistive index: Response to shock and its determinants in critically ill patients. Shock. 2019;52(1):43-51.[ DOI: 10.1097/SHK.0000000000001246] [PMID] [PMCID].
- Di Nicolo P, Granata A. Renal intraparenchymal resistive index: the ultrasonographic answer to many clinical questions. J Nephrol. 2019;32(4):527-38. [DOI: 10.1007/s40620-018-00567-x] [PMID].
- Cruz EG, Broca Garcia BE, Sandoval DM, Gopar-Nieto R, Gonzalez Ruiz FJ, Gallardo LD, Ronco C, Madero M, Vasquez Jimenez E. Renal resistive index as a predictor of acute kidney injury and mortality in COVID-19 critically ill patients. Blood purif. 2022;51(4):309-16. [DOI: 10.1159/000517469] [PMID] [PMCID].
- Darmon M, Schortgen F, Vargas F, Liazydi A, Schlemmer B, Brun-Buisson C, et al. Diagnostic accuracy of Doppler renal resistive index for reversibility of acute kidney injury in critically ill patients. Intensive Care Med. 2011;37(1):68-76. [DOI:10.1007/s00134-010-2050-y] [PMID].
- Zaitoun T, Megahed M, Elghoneimy H, Emara DM, Elsayed I, Ahmed I. Renal arterial resistive index versus novel biomarkers for the early prediction of sepsis-associated acute kidney injury. Intern Emerg Med. 2024 Mar 6:1-1. [DOI: 10.1007/s11739-024-03558-y] [PMID] [PMCID].
- Song J, Wu W, He Y, Lin S, Zhu D, Zhong M. Value of the combination of renal resistance index and central venous pressure in the early prediction of sepsis-induced acute kidney injury. J Crit Care. 2018;45:204-8. [DOI: 10.1016/j.jcrc.2018.03.016] [PMID].
- Oliveira RAG, Mendes PV, Park M, Taniguchi LU. Factors associated with renal Doppler resistive index in critically ill patients: a prospective cohort study. Ann Intensive Care. 2019;9(1):23.[DOI: 10.1186/s13613-019-0500-4] [PMID] [PMCID].
- Chawla LS, Eggers PW, Star RA, Kimmel PL. Acute kidney injury and chronic kidney disease as interconnected syndromes. N Engl J Med. 2014;371(1):58-66. [DOI: 10.1056/NEJMra1214243] [PMID] [PMCID]
پاییز .1401 دوره .28 شماره 4
Type of Study: Original |
Subject:
Internal Medicine
Received: 2024/01/21 | Accepted: 2024/10/22 | Published: 2023/03/10
Received: 2024/01/21 | Accepted: 2024/10/22 | Published: 2023/03/10
| Rights and permissions | |
 |
This work is licensed under a Creative Commons Attribution-NonCommercial 4.0 International License. |